Tracing Apps by Using AWS X-Ray
If you are running your Flogo app on the cloud or in your local environment, you can track your app performance or troubleshoot issues by using AWS X-Ray. For more information about AWS X-Ray, refer to AWS X-Ray.
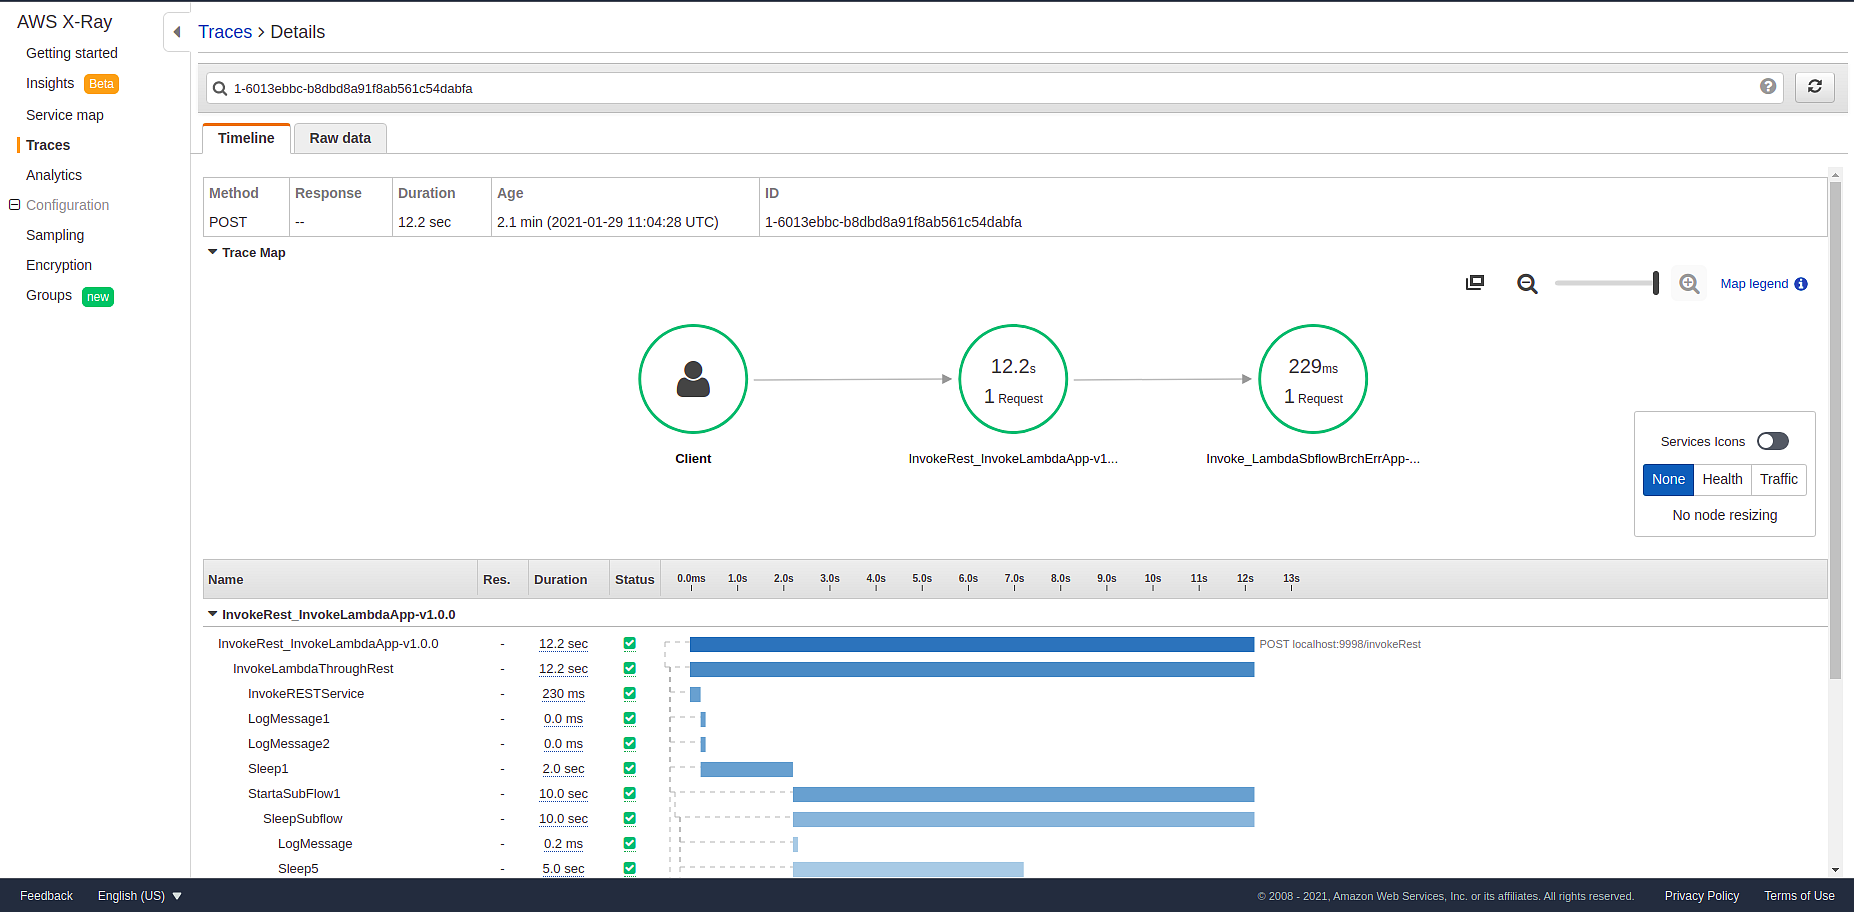
When you use AWS X-Ray for tracing, your app sends trace data to AWS X-Ray. X-Ray processes the data to generate a service map and searchable trace summaries. For each flow, subflow, and Activity, details such as execution time are displayed on the AWS X-Ray dashboard.
The following example shows the trace details of the InvokeRest_InvokeLambdaApp-v1.0.0 app. It includes details such as activities that were invoked, and their execution time and status.
- Knowledge of AWS X-Ray: For more information, refer to AWS XRay.
- For an app containing a non-Lambda trigger:
- AWS X-Ray daemon: You must have an AWS X-Ray daemon running on your machine to send trace data to the AWS X-Ray service. Alternatively, your app must have access to another machine where the daemon is running. Download the AWS X-Ray daemon from the AWS website and run the AWS X-Ray daemon.
- Environment variable: If the AWS X-Ray daemon and app are running on two different machines, set the environment variable
AWS_XRAY_DAEMON_ADDRESSto the IP address where the AWS X-Ray daemon is running for receiving traces. You need not set this variable if the daemon and app are running on the same machine.AWS_XRAY_DAEMON_ADDRESSand set it to the IP address where the AWS X-Ray daemon is running for receiving traces, in Engine variables under Environment controls. The daemon address could be<IP address>:<port>or<domain>:<port>. For example: 192.0.2.24:2000 or example.com:2000.
- AWS X-Ray daemon: You must have an AWS X-Ray daemon running on your machine to send trace data to the AWS X-Ray service. Alternatively, your app must have access to another machine where the daemon is running. Download the AWS X-Ray daemon from the AWS website and run the AWS X-Ray daemon.
- For an app containing a Lambda trigger:
- To trace the app end-to-end, TIBCO recommends that you enable the Active Tracing option in AWS along with the Flogo tracing feature. Active Tracing provides all the details of the app while the Flogo tracing feature provides details specific to the Flogo app. For example, details such as how long it took to initialize the container, are provided by Active Tracing. Details specific to the Flogo implementation (such as the flows, sub-flows, or activities executed) are provided by the Flogo tracing feature.
- For an app containing a Lambda trigger, you need not run the AWS X-Ray daemon. This is because AWS X-Ray is integrated with AWS Lambda.
- Add the following permissions to the execution role. For more information on how to add the permissions, refer to the AWS Documentation.
xray:PutTraceSegmentsxray:PutTelemetryRecords
Note: The AWS API Gateway Lambda and S3 Bucket Event Lambda triggers are not supported.
Enabling Tracing Using AWS X-Ray
To enable tracing using AWS X-Ray, set the FLOGO_AWS_XRAY_ENABLE environment variable to true. The default is false. FLOGO_AWS_XRAY_ENABLE environment variable to Engine variables under Environment controls and then set it to true. The default is false.
Search Using Annotations
You can search based on predefined Flogo annotations. The following annotation is available in this release:
flogo_flow_name: Name of the flow
Here is an example of using annotations to search:
annotation.flogo_flow_name="sampleFlow"
Metadata
The following metadata about an app is stored in the flogo namespace:
-
flow_name: Name of the flow -
Activity_name: Name of the Activity
This metadata can be used when debugging. You can use the metadata to identify the exact errors, stack traces, flow name, Activity name, and so on. Note that the metadata cannot be used for searching traces.