OpenTelemetry Collector
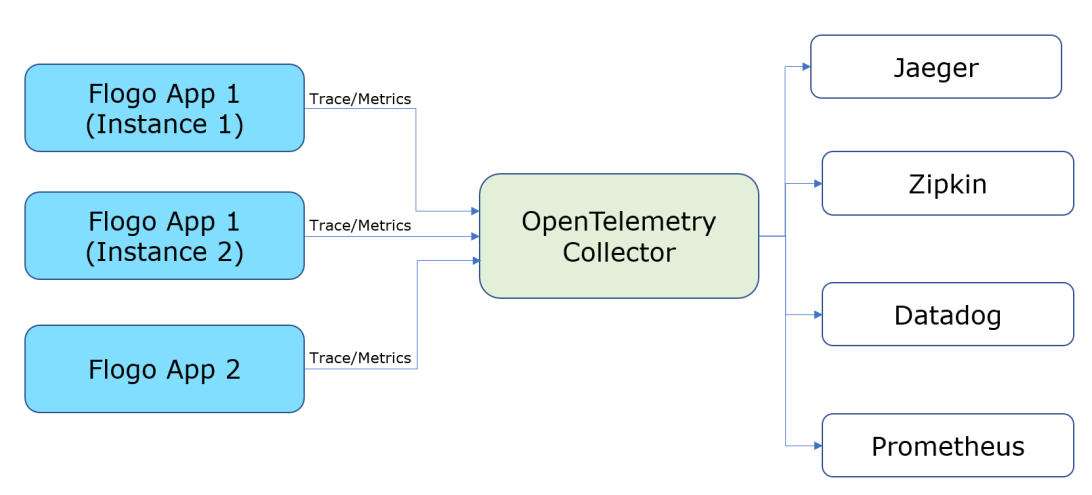
Flogo supports integration with OpenTelemetry (OT) Collector. The goal of this collector is to create standard software development kit for tracing, metrics and logging which different vendors like Jaeger, Zipkin, Datadog, Prometheus adopt. You have the flexibility to switch vendors without changing the application logic with OpenTelemetry.
Architecture
This is the schematic view of how the OT collector works:
Configuration
The parameters listed below are required for the configuration of the OT collector:
| Name | Required | Default | Description |
|---|---|---|---|
| FLOGO_OTEL_METRICS | Yes | False | Enable OpenTelemetry metrics for Flogo app |
| FLOGO_OTEL_METRICS_ATTRIBUTES | No | None | Add one or more custom attributes to the metrics. For example, FLOGO_OTEL_METRICS_ATTRIBUTES="deployment_type=flogo" |
| FLOGO_OTEL_OTLP_ENDPOINT | Yes | None | OpenTelemetry protocol (OTLP) receiver endpoint configured for OpenTelemetry Collector.
For gRPC protocol, set <host>:<otlp_grpc_port>
For http protocol, set https://<host>:<otlp_http_port> |
| FLOGO_OTEL_OTLP_HEADERS | No | None | Set one or more custom gRPC/HTTP headers in the request to the collector. For example, FLOGO_OTEL_OTLP_HEADERS="Authorization=Bearer <token>,API_KEY=<api_key_value>". |
| FLOGO_OTEL_TLS_SERVER_CERT | No | None | Set PEM encoded Server/CA certificate when TLS is enabled for OTLP receiver. You can configure a path to the certificate or use base64 encoded certificate value. A file path must be prefixed with "file://". e.g. FLOGO_OTEL_TLS_SERVER_CERT="file:///Users/opentelemetry/certs/cert.pem" or FLOGO_OTEL_TLS_SERVER_CERT=<base64_encoded_server_certificate>. When this certificate is not set, unsecure connection is established with the collector. |
Monitor Flogo apps metrics using OpenTelemetry
You can see the number of flows and activities executed in the app as per the below metrics:
| Metrics | Label | Description |
|---|---|---|
| flogo_activity_executions_total | - | Total number of times the activity is started, completed, or failed. |
| app_name | Name of application | |
| app_version | Version of application | |
| flow_name | Name of flow | |
| activity_name | Name of activity | |
| state | State of activity - Started, Completed or Failed | |
| host_name | Name of the host or app instance ID | |
| flogo_flow_executions_total | - | Total number of times the flow is started, completed or failed |
| app_name | Name of application | |
| app_version | Version of application | |
| flow_name | Name of flow | |
| state |
State of flow - Started, Completed or Failed |
|
| host_name | Name of the host or app instance ID |
Example
FLOGO_OTEL_METRICS=true FLOGO_OTEL_OTLP_ENDPOINT="localhost:4317" FLOGO_OTEL_METRICS_ATTRIBUTES="deployment=local,product=flogo" ./<app-executable>