Smart Engine Reports
When Smart Engine is enabled for an app instance, you can generate reports for that app that include information such as increased memory usage, high CPU, excessive number of threads and more. Reports are generated in HTML format and stored in a smartengine_report.zip file in the cloud. Using the API you can download, extract, and then view your reports. Based on the recommendations at the bottom of the report, modify the properties and redeploy the app for better performance.
Sample Report
The HTML report has the following sections:
| Section | Description |
|---|---|
|
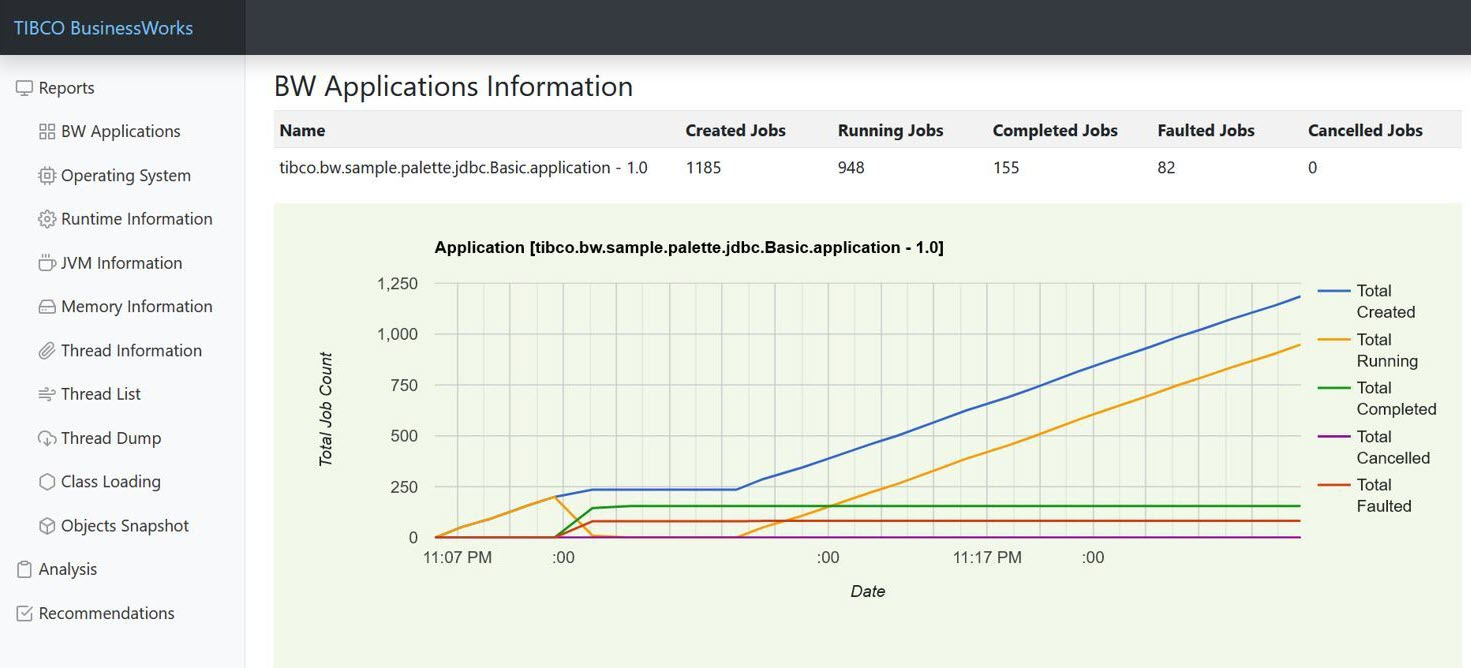
BW Applications |
Total Job Count / New Job CountDisplays the TIBCO BusinessWorks apps in a table. Each row shows the number of jobs for the TIBCO BusinessWorks processes in an app, such as Created Jobs, Running Jobs, Completed Jobs, Faulted Jobs and Canceled Jobs. After the TIBCO BusinessWorks apps table, line charts are shown for each app, such as Total Job Count chart and New Job Count chart. When an app has incoming HTTP requests, Total HTTP Connector Calls chart, and New Http Connector Calls chart are shown. ProcessesFor each TIBCO BusinessWorks app, the TIBCO BusinessWorks processes in the app are shown in a table. Each row shows the number of jobs for a TIBCO BusinessWorks process, such as Created, Completed, Faulted and Suspended. After the TIBCO BusinessWorks processes table, line charts are shown for each TIBCO BusinessWorks process, such as Total Job Count chart and New Job Count chart. Process ActivitiesFor each TIBCO BusinessWorks process, the TIBCO BusinessWorks activities in the process are shown in a table.
Each row shows the runtime information of an activity such as Recent Status, Executed, Faulted, Recent Elapsed Time (ms), Min Elapsed Time (ms), Max Elapsed Time (ms), Total Elapsed Time, Recent Activity Output Memory (bytes), Min Activity Output Memory (bytes) and Max Activity Output Memory (bytes).
The processes and activities statistics data are available when the app statistics feature is enabled on the Enable Smart Engine API method ( |
|
Operating System |
Dislays the operating system information in a table, such as OS Name, OS Version, OS Architecture, Available Processors, Committed Virtual Memory, Free Physical Memory, Total Physical Memory, Free Swap Space, Total Swap Space, JVM Process CPU Time, JVM CPU Load, System CPU Load, and System Load Average. After this table, line charts are shown, such as Free Physical Memory and Free Swap Space chart, JVM CPU Load and System CPU Load chart, and System Load Average chart. |
|
Runtime Information |
Displays the runtime JVM information in a table, such as Process Name, Spec Name, Spec Vender, Spec Version, VM Name, VM Version, VM Vender, Management Spec Version, Start Time, Up Time, Class Path, Library Path, Input Arguments, and System Properties. |
| JVM Information |
Displays the overall JVM information in a table such as PID, Java Vender, Java Name, Java Version, OS User, CPU Load, Up Time, GC Time, GC Count, GC Load, Max Heap, Used Heap, Used Non-Heap, Total Loaded Class Count, Thread Count, Peak Thread Count, and Total Started Thread Count. After this table, Top Threads information is shown in a table. Each row shows the data of a thread, such as TID, Name, State, Thread CPU Usage(%), Thread Total CPU Usage(%) and Blocked Thread. After that, Top Methods information is shown in a table. Each row shows the data of a method, such as Class Name, Method Name, and Total CPU Time(ms). |
|
Memory Information |
Displays the JVM memory information in a table, such as Max Heap Size, Committed Heap Size, Init Heap Size, Used Heap Size, Max Non-Heap Size, Committed Non-Heap Size, Init Non-Heap Size, and Used Non-Heap Size. After the table, line charts are shown, such as Heap Memory Usage chart and Non-Heap Memory Usage chart. |
|
Thread Information |
Displays the overall JVM threads information in a table, such as Thread Count, Daemon Thread Count, Peak Thread Count, Total Started Thread Count, Current Thread CPU Time, and Current Thread User Time. After this table, a Thread State Count table is shown. Each row shows the number of threads in a thread state, such New, Runnable, Blocked, Waiting, and Timed Waiting. After that, line charts are shown, such as JVM Thread Count chart and JVM Thread State Count chart. |
|
Thread List |
Displays the JVM threads in a table. Each row shows the data of a thread, such as TID, Name, State, CPU Time(ms), and Allocated Heap Size. |
|
Thread Dump |
Displays the JVM threads dump in a table. Each row shows the thread dump of a thread, such as TID, Thread Name, Thread State, Thread Allocated Heap, and Stack Trace. |
|
Class Loading |
Displays the JVM class loading information in a table, such as Loaded Class Count, Total Loaded Class Count, and Unloaded Class Count. After the table, a line chart of Classes Count is shown. |
|
Objects Snapshot |
Displays the JVM objects in a table. Each row shows the data of an object, such as number of Instances, Allocated Heap Size, and Class name. |
|
Analysis |
Displays the analysis of various performance use cases. When the triggers are evaluated, if a trigger condition is met for a performance use case, a corresponding analysis is provided and shown in the report. |
|
Recommendations |
Displays the recommendations for various performance use cases. When the triggers are evaluated, if a trigger condition is met for a performance use case, related recommendations are provided by corresponding recommendation providers and shown in the report. |
Related Topics
Monitoring Apps with the TIBCO Cloud™ Integration API
Reporting with the TIBCO Cloud™ Integration API Using TIBCO BusinessWorks Smart Engine