Viewing Execution History
TIBCO Cloud™ Integration - Connect logs the activities for every execution of every app and displays those activities on the Execution History tab of the App Details page for up to 45 days. Execution History can be accessed from within an app by opening the app and the selecting the Execution History tab.
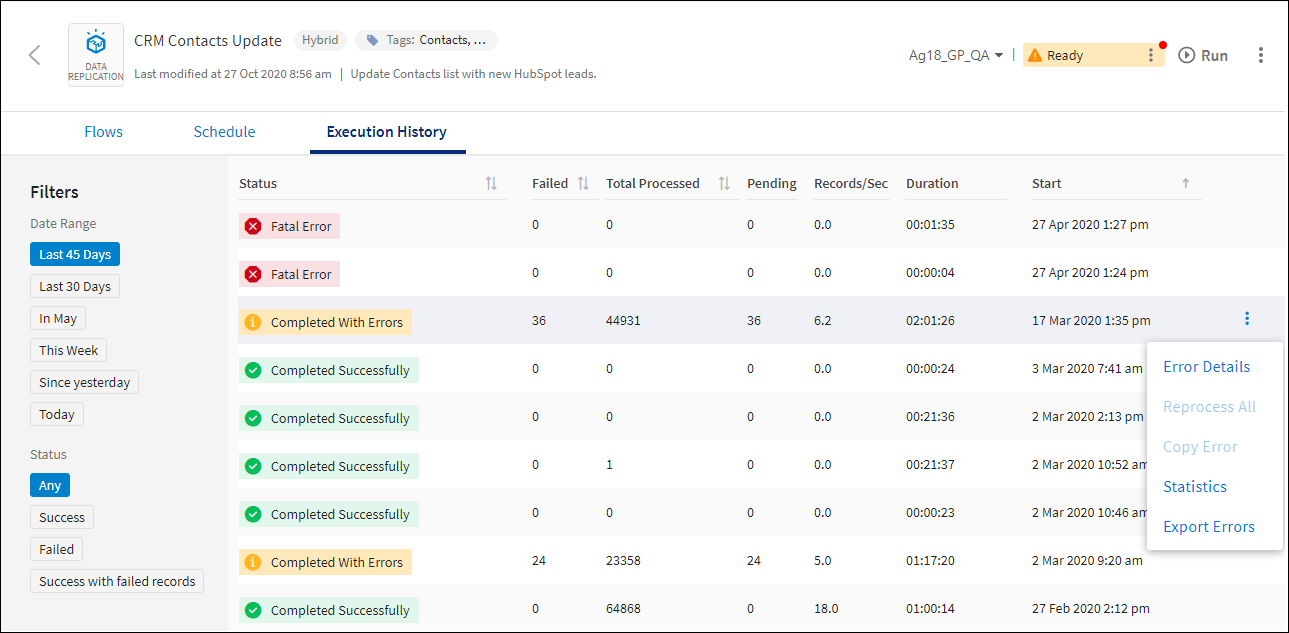
App Details — Execution History Tab
If your Connect on-premise agent is running in a virtual machine and you clone that virtual machine, an exact duplicate of the agent is generated with the same internal ID. This can cause incorrect data to display in TIBCO Cloud™ Integration - Connect because the Cloud cannot distinguish between the two agents. On the original virtual machine, shut down the Connect on-premise agent before cloning. In the new virtual machine, install a new Connect on-premise agent, move your apps to that agent, and then delete the copied agent.
Execution History includes the following information.
| Option | Definition |
|---|---|
|
Columns |
|
|
Status |
Indicates whether this execution of the app completed successfully or had errors. Statuses include: |
|
|
Fatal Error — Execution stopped once an error was encountered. Select the error to access the Fatal Error Details dialog with the complete error. |
|
|
Completed With Errors — Execution completed but there are records with errors. Select the status to display the Execution History Details dialog. |
|
|
Completed Successfully — Execution completed with no errors. Select the status to display the View Statistics dialog. |
|
|
App is running. |
|
Failed |
Number of failed records. |
|
Total Processed |
Number of records processed in this execution. |
|
Pending |
Number of failed records that are available for reprocessing. |
|
Records/Sec |
Number of records processed per second. |
|
Duration |
Length of time for this execution of the app in hours:minutes:seconds. |
|
Start |
Time this execution of the app began. |
|
Menu |
|
|
Error Details |
Open the details page for the selected execution of this app. |
|
Reprocess All |
If an On schedule app execution contains any failed records, you can select Reprocess All to reprocess the failed records as described in Managing Failed On Schedule And On Event App Execution History Records. Note: Data replication apps do not have the option to reprocess. Correct the errors and run the app again. See Managing Failed Data Replication App Execution History Records.
|
|
Copy Error |
Copies the Error Details for an app execution that ends due to a Fatal Error. |
|
Statistics |
Displays duration, records processed, records failed, operation type and action for every flow and entity processed by the app execution. See Viewing Execution Statistics. |
|
Export Errors |
Export errors for the selected execution to a CSV file. See Exporting the Execution Error List. |
Execution History Filters
Configure the filters on the Execution History tab to locate the executions you need. Filters include the following options:
| Field | Definition |
|---|---|
|
Status |
Limits results based on the selected Status. Any — All executions for the app. This is the default setting. Success — Successful executions. Failed — Executions with Fatal Errors. Success with failed records — Executions with Record Errors. |
|
Date Range |
Limits results by the date of execution. Date ranges use UTC time. Ranges include: Last 45 days — All executions for the last 45 days. Execution history is stored for a maximum of 45 days, therefore this filter returns all stored executions. Last 30 Days — Everything for the last 30 days, including today. In <CurrentMonth> — Everything since the 1st of this month. This Week — Everything since the start of day Sunday. Since Yesterday — Past 24 hours. Today — Everything for the past hour. |