Viewing App Monitoring Details
You can monitor the process and activity instrumentation statistics of your TIBCO BusinessWorks, TIBCO Flogo®, and Node.js cloud and remote apps on the Monitoring tab of the App Details page.
To view app monitoring information:
- Log in to TIBCO Cloud™ Integration.
- Click the Apps tab.
- Click a running TIBCO BusinessWorks, Flogo, or Node.js app in the listed apps.
- Click the Monitoring tab.
- Select an app instance from Instance list.
- The tabs and panes within the Monitoring tab and the monitoring information displayed vary, based on the app type. This is described in the following sections.
- There is a refresh button above and to the right of each statistics table. Click the refresh button to view the latest statistics.
Monitoring TIBCO BusinessWorks Apps
For monitoring TIBCO BusinessWorks apps, the Monitoring tab contains the following:
-
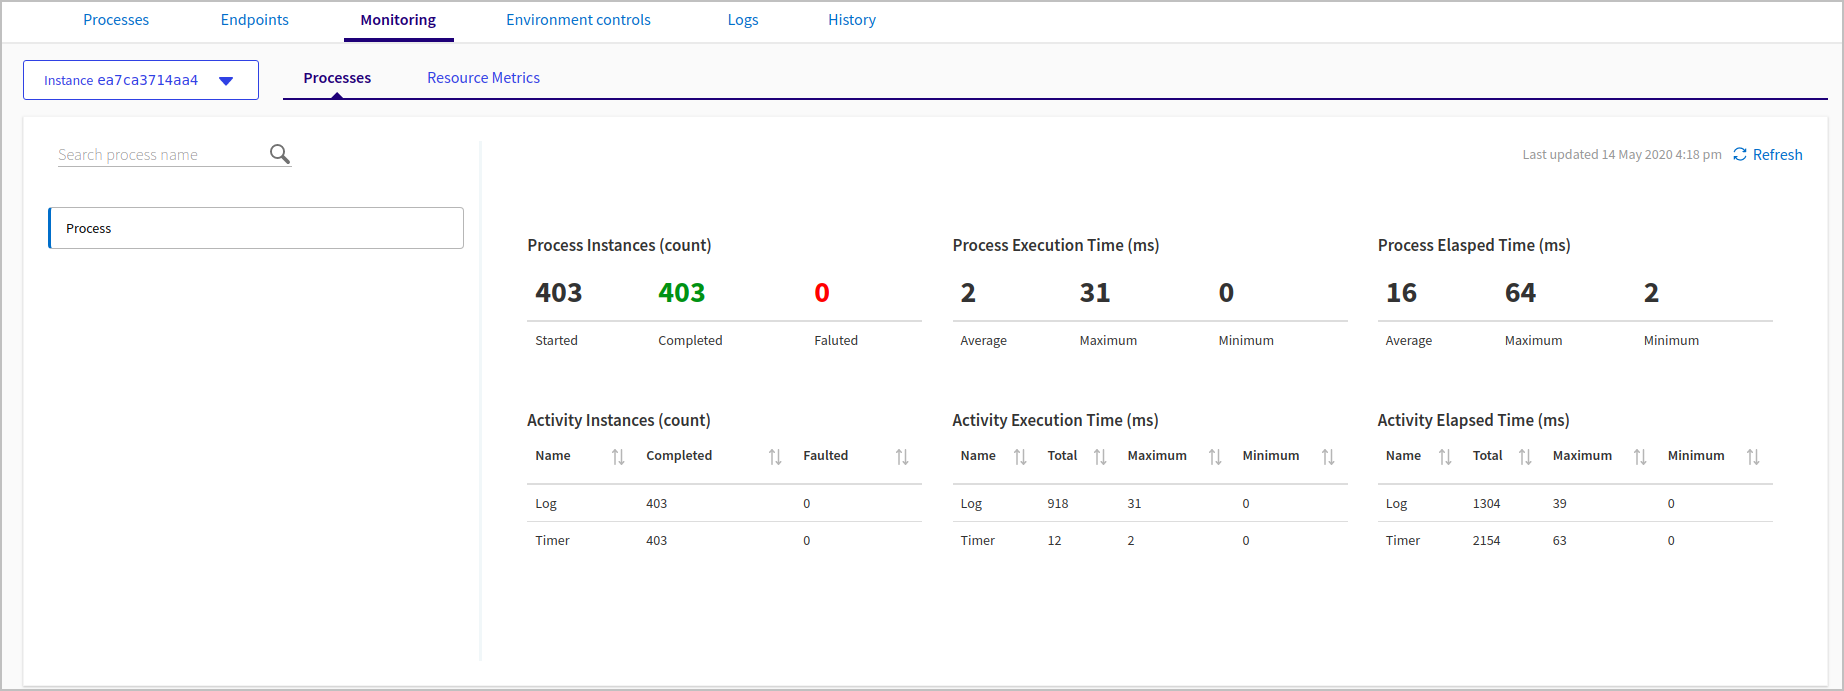
The Processes tab shows information on processes, such as the number of instances that have started, completed, and failed, the execution time, and the elapsed time. Select a process from the list on the left to see its details. You can also use the search control to find a process in the list.
-
The Resource Metrics tab contains two panes. Click one of the panes on the left for more information:
-
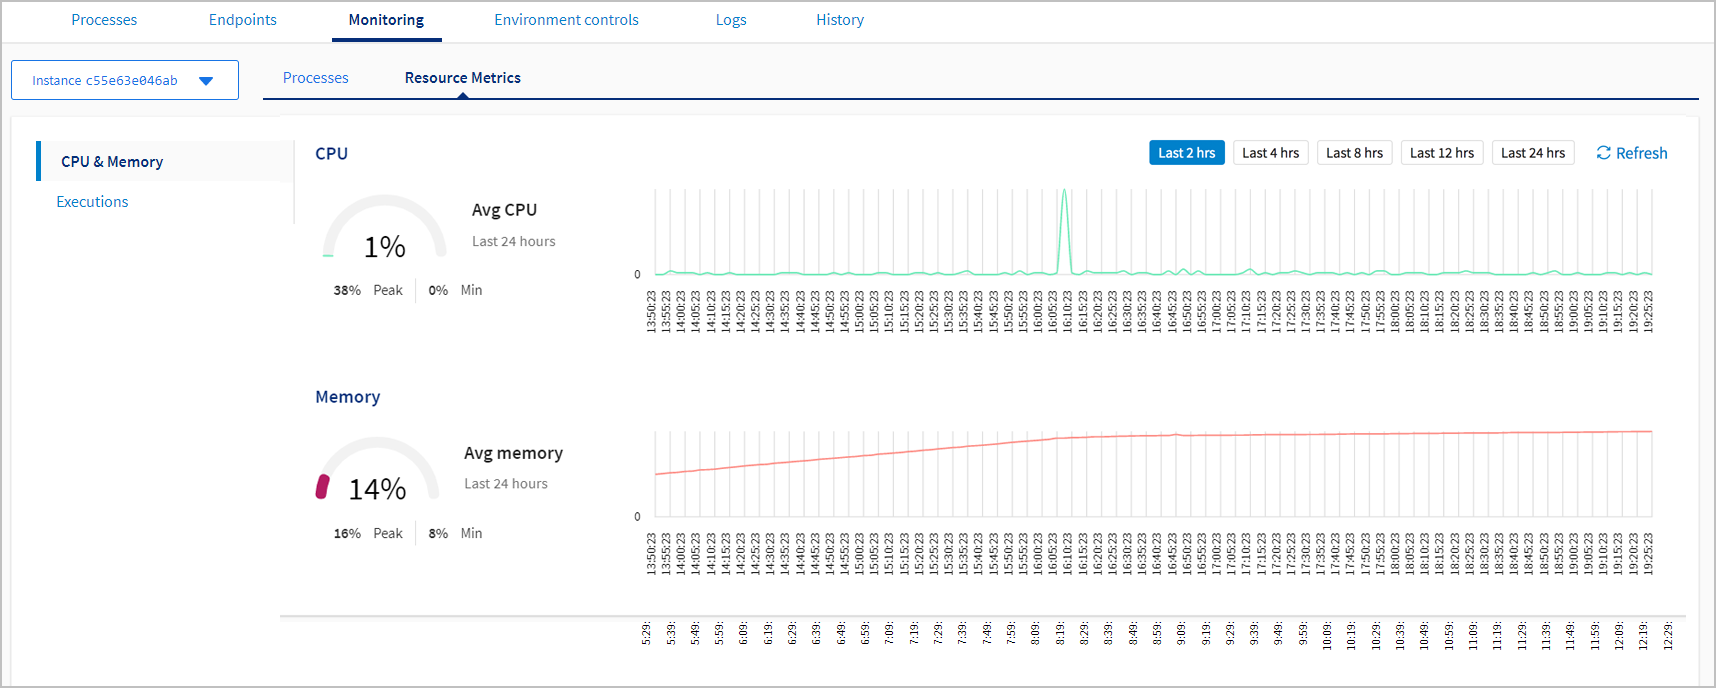
The CPU & Memory pane shows gauges for peak, minimum, and average CPU and memory used over the last 24 hours. A graph shows CPU and memory used in a selected time period. The default time period is two hours; click a button to show a different time range. Hover over a point in the graph to see the measurement at that time period.

-
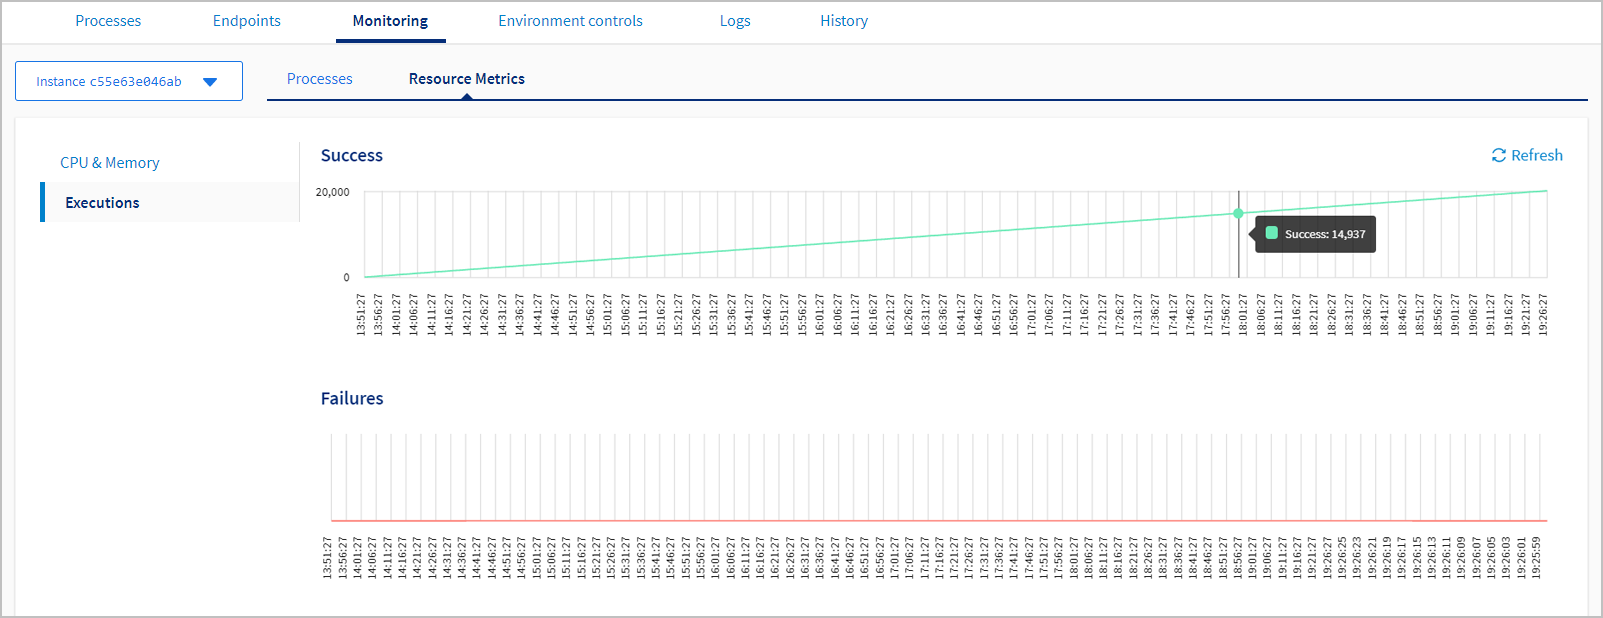
The Executions pane shows a graph of the number of executions that were successful or failed since the start of that instance for a maximum of the last 24 hours for the selected instance. Hover over a point in the graph to see the execution count at that time period.
-
The CPU & Memory pane shows gauges for peak, minimum, and average CPU and memory used over the last 24 hours. A graph shows CPU and memory used in a selected time period. The default time period is two hours; click a button to show a different time range. Hover over a point in the graph to see the measurement at that time period.


Note: Process instrumentation (monitoring) data can be disabled for TIBCO BusinessWorks apps by setting the Engine variable value
BW_INSTRUMENTATION_ENABLED to false.Monitoring Flogo Apps
For monitoring Flogo apps, the Monitoring tab contains the following:
-
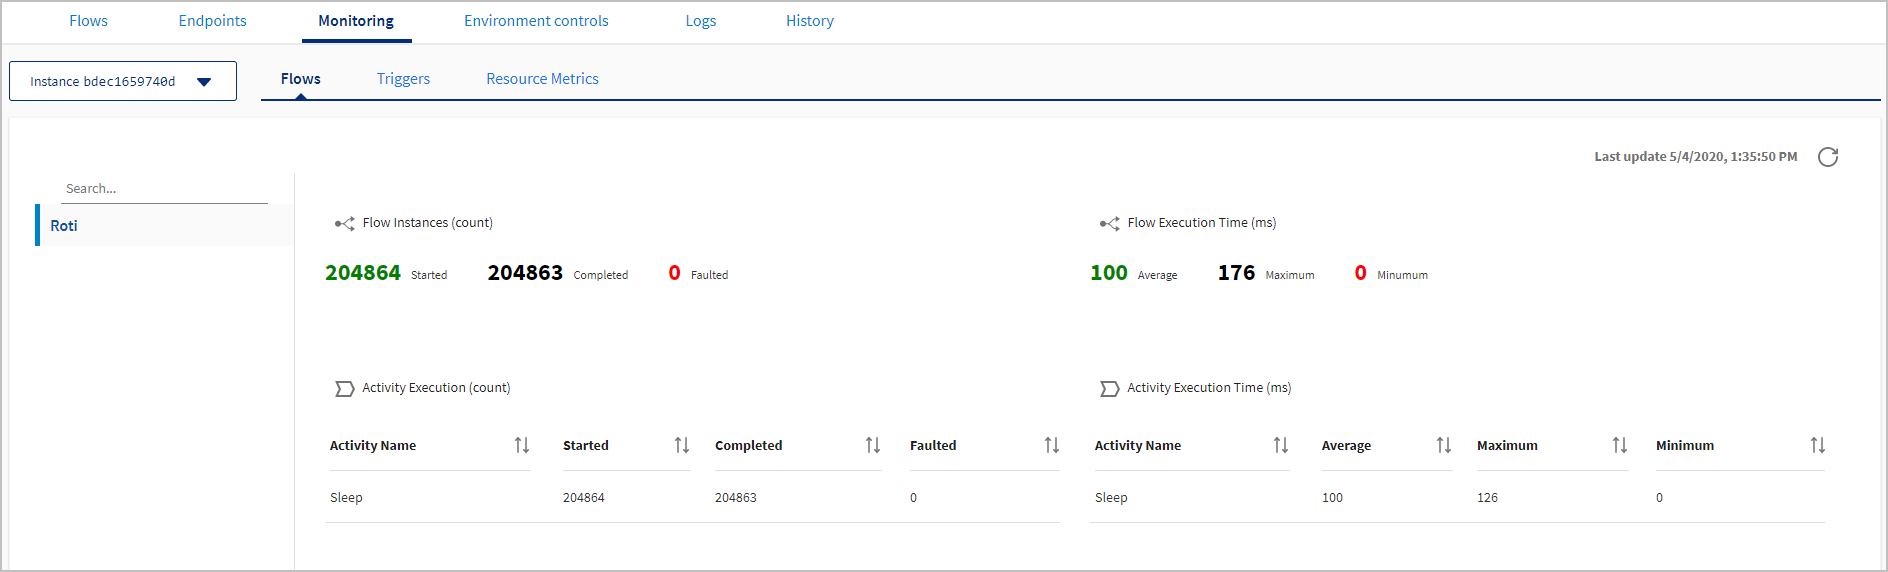
The Flows tab shows information on flows, such as the number of flow instances that have started, completed, and faulted, flow execution time, and activity execution count and time. Select a flow from the list on the left to see its details. You can also use the search control to find a flow in the list.
-
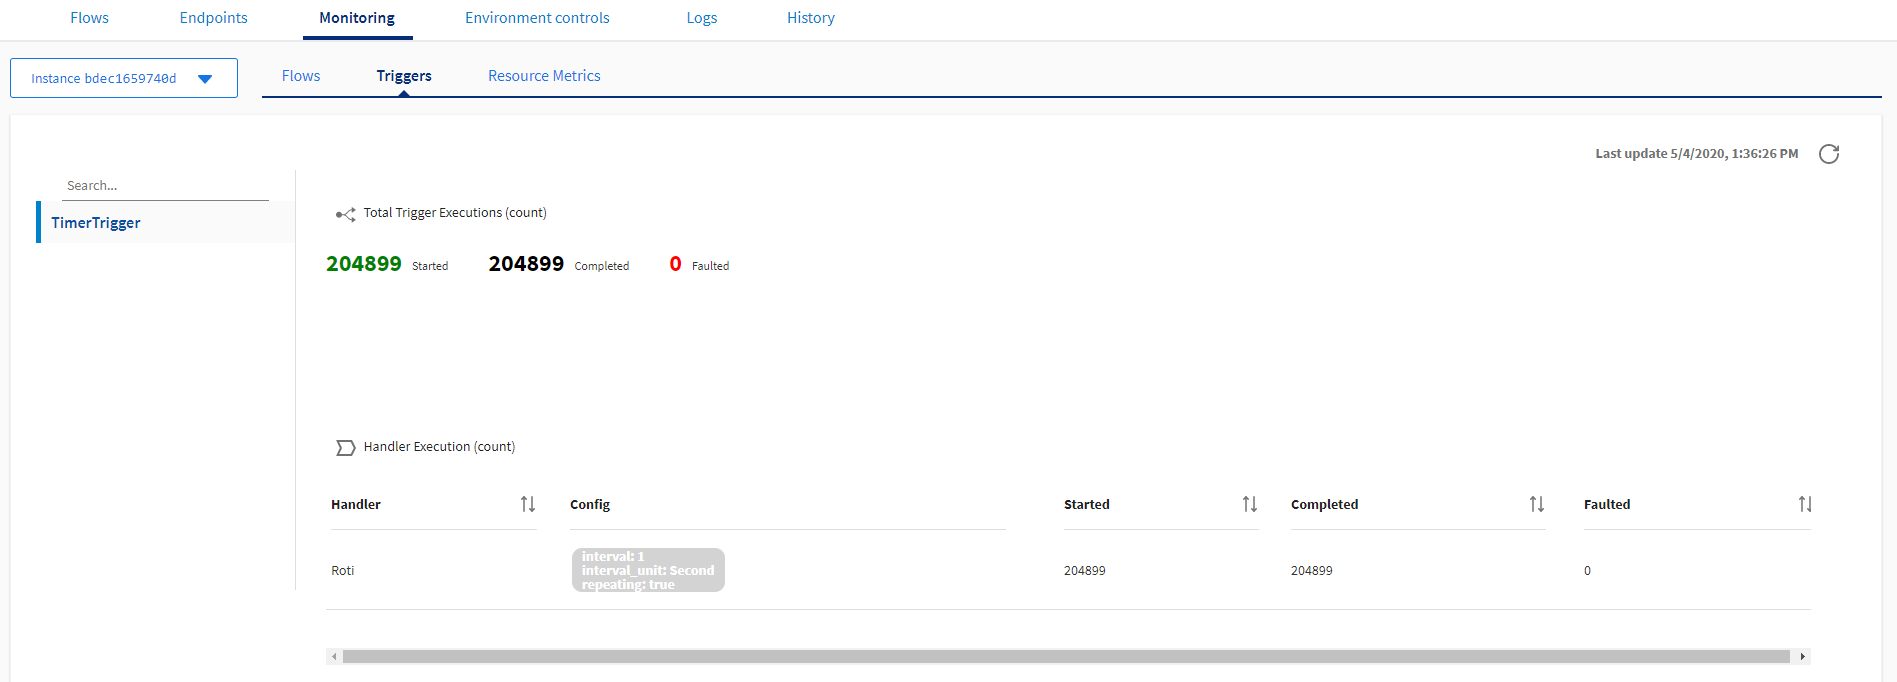
The Triggers tab shows information on trigger execution, such as the number of trigger executions that have started, completed, and faulted, handler execution count. Select a trigger from the list on the left to see its details. You can also use the search control to find a trigger in the list.

- The Resource Metrics tab has CPU & Memory and Executions panes similar to TIBCO BusinessWorks apps.

Monitoring Node.js Apps
For Node.js apps, the Monitoring tab contains a Resource Metrics tab with a CPU & Memory pane similar to TIBCO BusinessWorks and Flogo apps.
Viewing Remote Apps
To monitor remote apps, you must install and run a TIBCO Cloud™ Integration - Hybrid Agent. See Using the TIBCO Cloud™ Integration - Hybrid Agent for more information.
Role Requirements
- All users can view the Monitoring tab for apps in their organization.